
文章阅读目录大纲

imports "clustering" from "MLkit";
require(graphics2D);
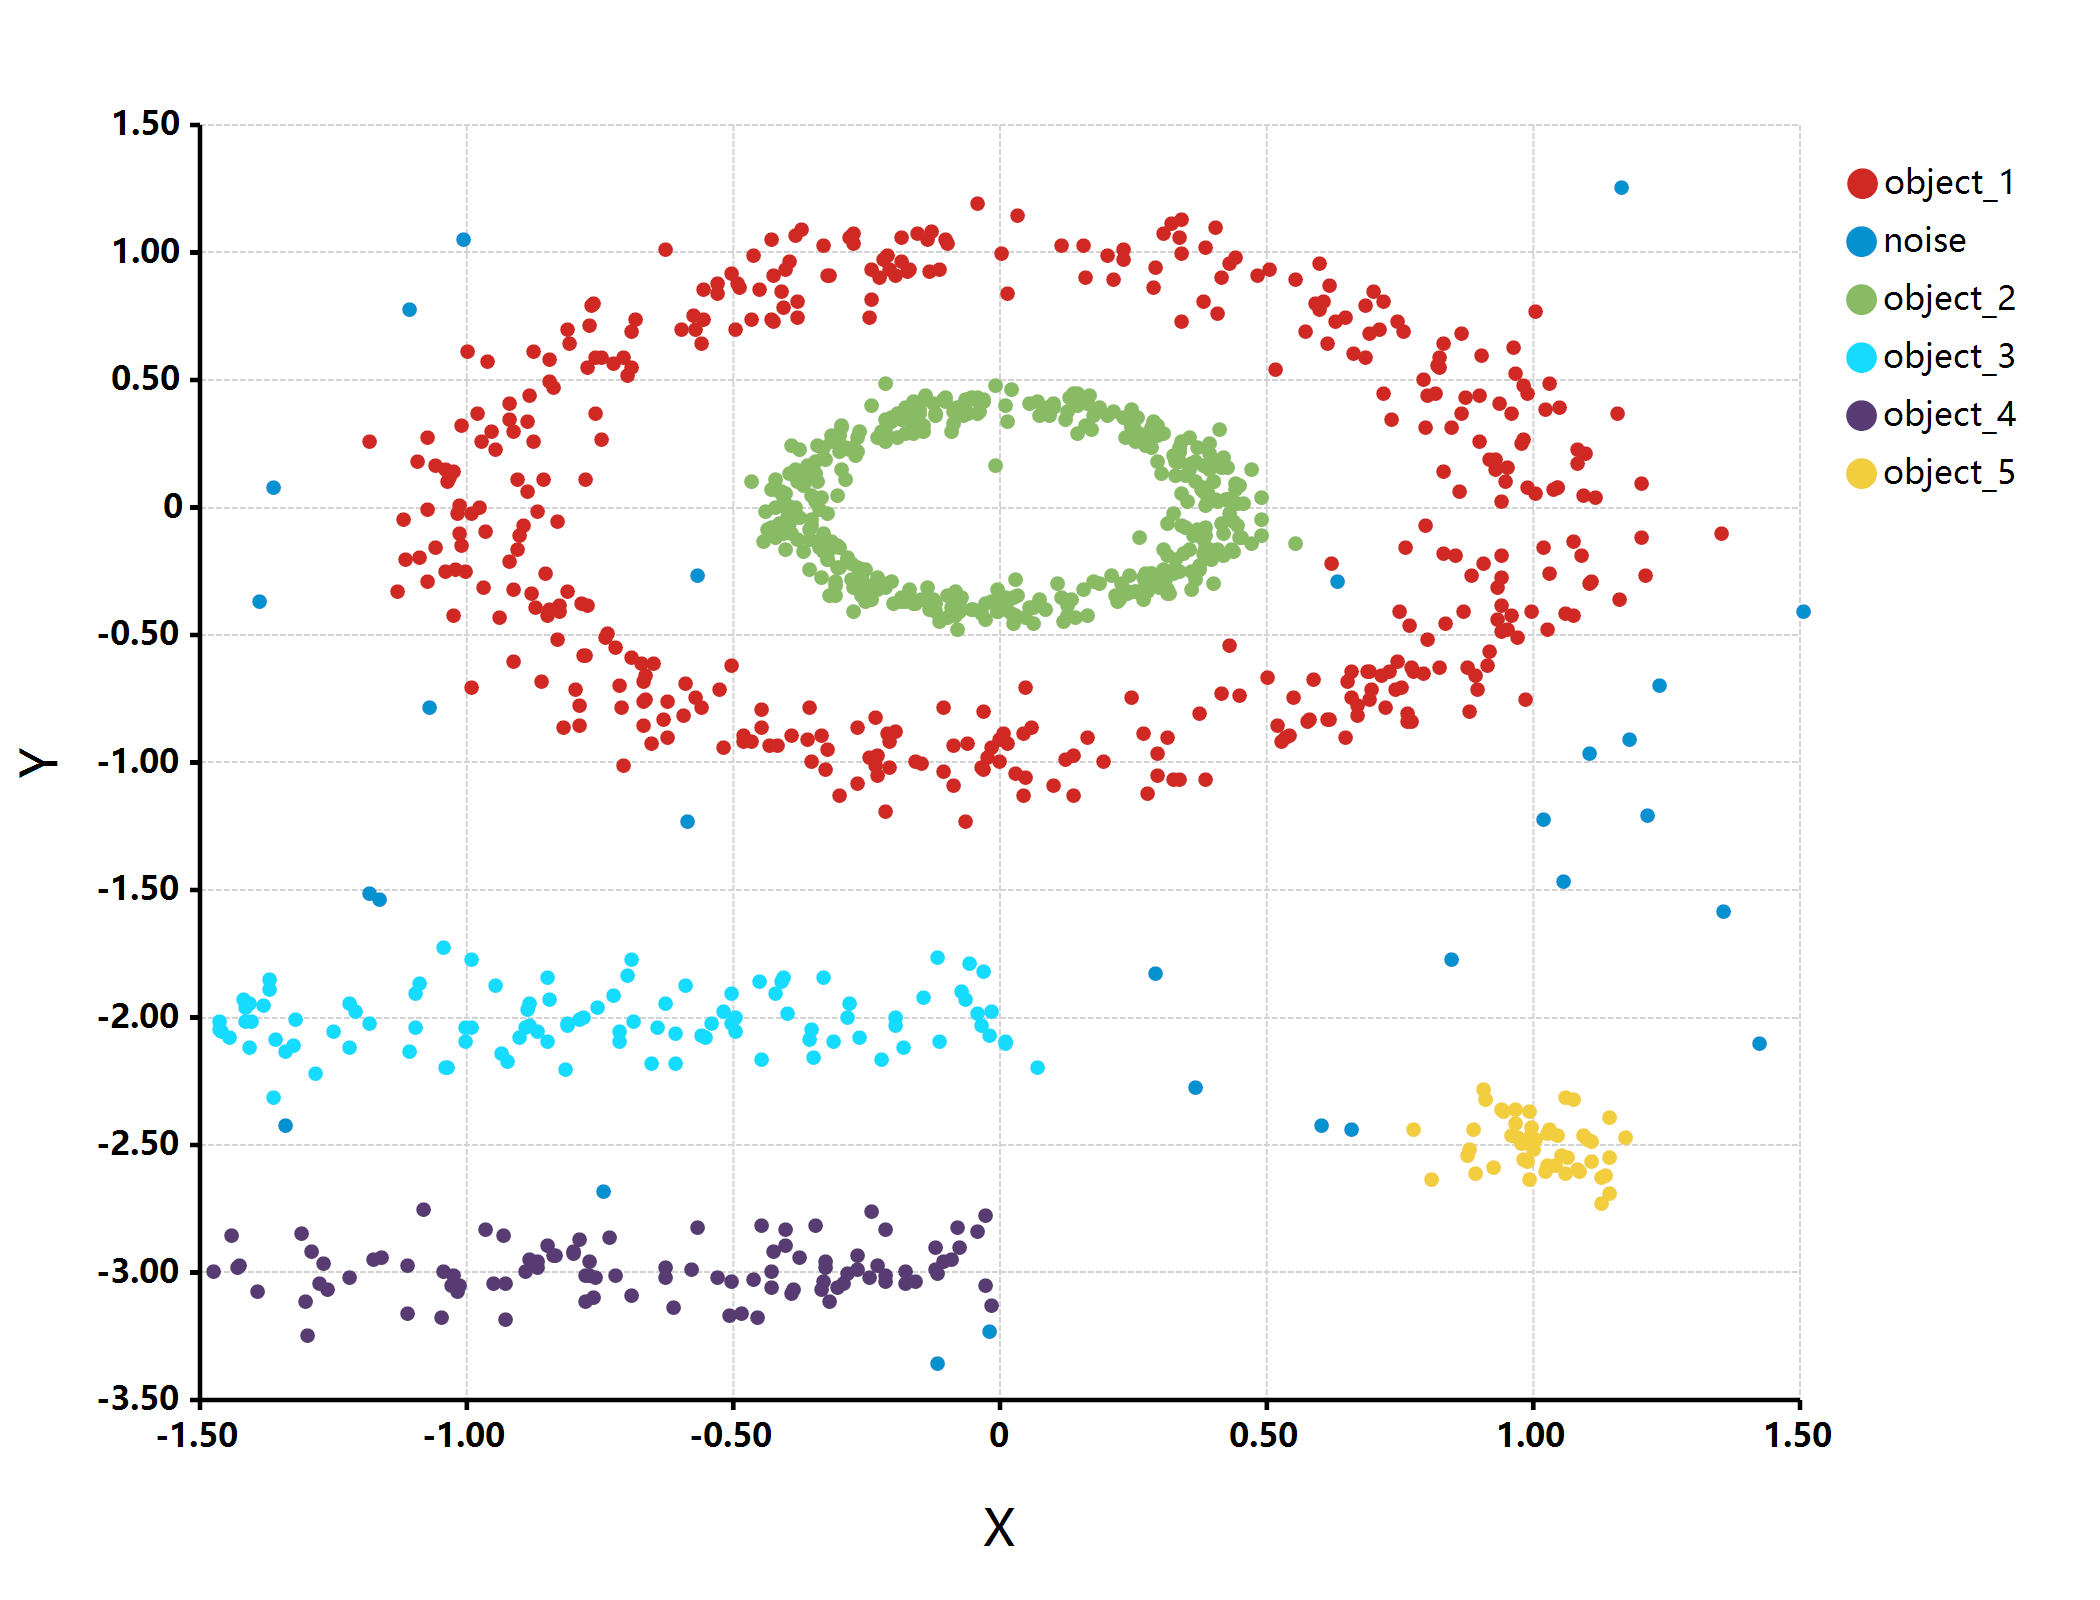
multishapes = read.csv("./multishapes.csv");
[x, y] = list(multishapes[, "x"], multishapes[, "y"]);
print(multishapes, max.print = 13);
# detect object shapes
objects = graphics2D::pointVector(multishapes[, "x"], multishapes[, "y"]) |> dbscan_objects();
objects[objects == "-1"] = "noise";
objects = ifelse(objects == "noise", objects, `object_${objects}`);
# show object detection result
bitmap(file = "./object_detection.png") {
plot(multishapes[, "x"], multishapes[, "y"],
class = objects,
grid.fill = "white",
padding = "padding: 125px 300px 200px 200px;",
colorSet = "paper"
);
}高级数据科学家 at 苏州帕诺米克
Working on Engineered bacteria CAD design on its genome from scratch. Writing scientific computing software for Tianhe & Sunway TaihuLight supercomputer. Do scientific computing programming in R/R# language, he is also the programming language designer of the R# language on the .NET runtime.
Latest posts by 谢桂纲 (see all)
- 基因组代谢酶层级嵌入 - 2026年2月23日
- 吉布斯LDA主题分解 - 2026年2月23日
- 酶EC编号结构解析 - 2026年2月17日

No responses yet